Logistics and Supply Chain
INTRO TO LOG - A1
A4 Infographic Highlighting The Supply Chain Management Context, Objectives, Map, Issues, Opportunities, and Local Industry Insights In A Selected Industry.
Table of Contents
expand_more expand_lessTable of Contents
DETAILED INSTRUCTION
A. ASSESSMENT RECAP
- Prepare an infographic highlighting the supply chain management context, objectives, map, issues, opportunities, and local industry insights in a selected industry.
- Students include essential information about the RMIT brand, their name, Student ID, and possibly the selected product line logos.
- Students are required to submit submissions to Canvas System, in the following format: doc, docx, pdf, ppt, pptx, and mp4.
Structure:
1. The supply chain management context
2. The supply chain objectives
3. A Supply chain map
4. Major issues or challenges
5. Opportunities for future development
6. What might be done in the selected local industry?
B. KEYWORDS EXPLANATION
1. Supply Chain Map: A visual representation of the movement of products, information, and finances through a supply chain from initial suppliers to end customers.
- Inbound Flow: The movement of raw materials, components, information, and funds from suppliers into a company or production facility. It includes procurement processes and logistics.
- Outbound Flow: The movement of finished products and related information from the point of production to the end consumer. It encompasses distribution, delivery, and logistics channels.
C. DETAILED OUTLINE
I. The supply chain management context: the competitiveness of this product line and the industry
- Industry Statistics: market size, growth rates, relevant trends, … Use numbers, charts, graphs, or diagrams to visualize data
- Product Line Features: Showcase key features and strengths of the product line. Use bullet points or icons to make this information easily scannable.
Tip 1: Use a variety of sources - company websites, industry reports, … to gather data and insights. Some recommended professional sources (not limited to):
- Euromonitor (can be founded on RMIT Library)
- Statista website (sign up an account with Student ID for image download)
- http://vietnamsupplychain.com/
Example:
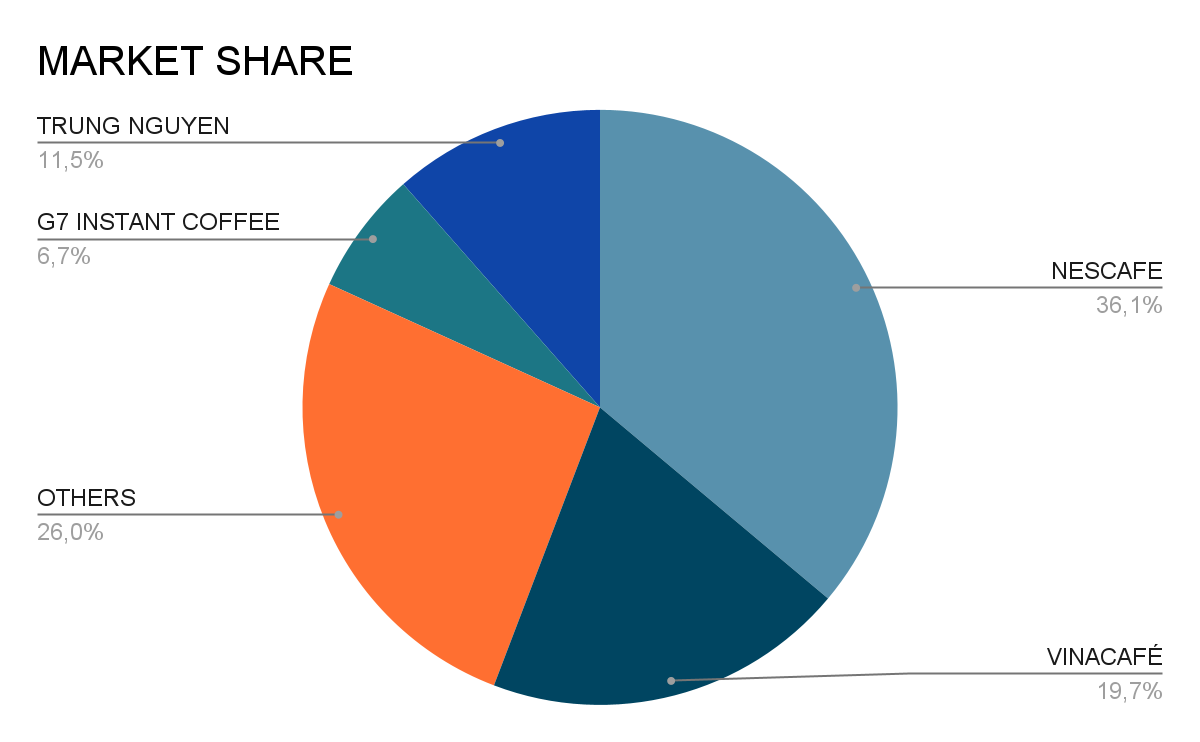
“Trung Nguyen accounts for 11.5% of the instant coffee market share in Vietnam, making it one of 3 dominant leaders in the industry.” → Use pie chart to present instant coffee market share in Vietnam
“700 outlets nationwide, 1,000 successful franchise contracts, VND 4.2 trillion in revenue” → Bullet points with an emphasis on numbers
Charge your account to get a detailed instruction for the assignment