Econ fin
MACRO FOR DECISION MAKING - A1 (Template Version)
Economic Data Analysis The first sentence - Overall trend for the economic state and all five indicators: Overall, Norway experienced steady growth pre-pandemic before a muted COVID-induced downturn in 2020, followed by a strong rebound (IMF, 2022; Statistics Norway, 2020). The next 2-3 sentences: Break down the overall trend into small periods for analysis. It is highly recommended to state any differences or similarities in the 5 indicators’ trends.
Table of Contents
expand_more expand_lessTable of Contents
DETAILED INSTRUCTION
A/ ASSIGNMENT RECAP
- Write a 1000-word report to analyze a country’s economic data over 5 years, including GDP, inflation, unemployment, and other metrics.
- Use the AD-AS model to discuss the country's response to COVID-19.
Suggested Structure:
- Economic Data Analysis (Suggested 100 words)
- AD-AS Model Analysis (Suggested 400 words)
- Introduction
- Discussion
- Conclusion
- Current State Analysis & Recommendation (Suggested 500 words)
- Current State Analysis
- Policy Recommendation
- Evaluation
B/ KEYWORD EXPLANATIONS
- GDP (Gross Domestic Product)
GDP is the sum of gross value of goods and services added by all resident producers in the economy.
- Inflation
Inflation is the rate of increase in prices over a given period of time. It is measured by the Consumer Price Index (CPI). There are different types and sources of inflation, including:
- Demand-pull inflation is caused by an increase in aggregate demand that is faster than aggregate supply. This can happen from things like expansionary monetary policy.
- Cost-push inflation is caused by drops in aggregate supply from increases in production costs like wages and raw materials. This leads firms to raise prices.
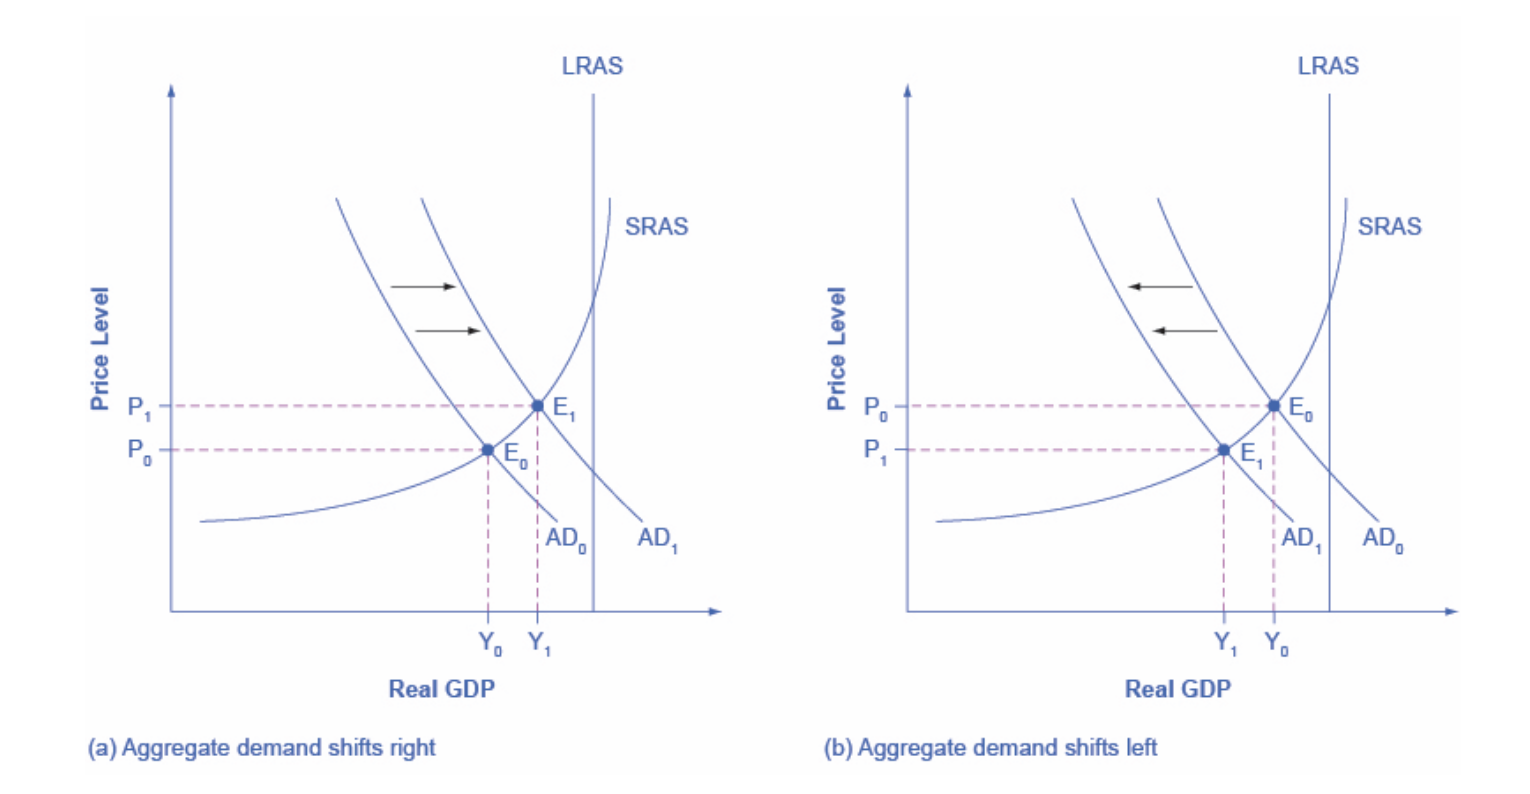
- Aggregate demand
Aggregate demand (AD) is the total spending on domestic goods and services in an economy. The AD curve slopes downward, meaning that as the price level falls, the quantity of goods and services demanded rises. There are several factors that can cause the aggregate demand curve to shift, including
- Consumer spending - If consumers spend more, AD will shift right. If they spend less, AD shifts left.
- Spending - If firms invest more in capital, AD shifts right. Less investment causes a leftward shift.
D/ DETAILED OUTLINE
- Part 1: Economic Data Analysis
- The first sentence - Overall trend for the economic state and all five indicators: Overall, Norway experienced steady growth pre-pandemic before a muted COVID-induced downturn in 2020, followed by a strong rebound (IMF, 2022; Statistics Norway, 2020).
- The next 2-3 sentences: Break down the overall trend into small periods for analysis. It is highly recommended to state any differences or similarities in the 5 indicators’ trends.
Example:
- GDP: From 2018-2019, most indicators were stable except for a GDP uptick by 3.5% in 2018.
- Unemployment: In 2020, unemployment rose 4.5% while other metrics declined amidst COVID disruptions.
- Inflation: Meanwhile, inflation accelerated above the 2% target to 3.5% by 2022 as demand rebounded faster than supply post-lockdowns (Statistics Norway, 2022).
Charge your account to get a detailed instruction for the assignment