Econ fin
[SEM A 2024] BASIC ECONOMETRICS - A2
Determinants of the IEI for a sample of countries, including reviewing academic literature, running multiple regressions, interpreting results, testing hypotheses, and proposing policy recommendations
Table of Contents
expand_more expand_lessTable of Contents
DETAILED INSTRUCTION
A/ ASSIGNMENT RECAP
● Write a 2000-word report analyze determinants of the IEI for a sample of countries, including reviewing academic literature, running multiple regressions, interpreting results, testing hypotheses, and proposing policy recommendations
Suggested Structure:
I. Part 1: Overview and Data Description
A. Overview of Topic (Suggested 150 words)
B. Data description (Suggested 250 words)
II. Part 2: Initial estimation
A. Linear Regression Model (Suggested 250 words)
B. Model Estimation Using OLS (Suggested 250 words)
III. Part 3: Interpretation
A. Interpret R-Squared (Suggested 250 words)
B. F-test Interpretation (Suggested 250 words)
C. T-test Interpretation (Suggested 250 words)
D. Expectation & Actual Results Comparison (Suggested 250 words)
E. Models Comparison (Suggested 250 words)
IV. Part 4: Further Estimation
A. Dummy variables (Suggested 250 words)
B. Interaction term (Suggested 250 words)
C. Alternate model Estimation (Suggested 250 words)
V. Part 5: Conclusion
A. Findings Summary (Suggested 150 words)
B. Policies Proposal (Suggested 250 words)
B/ KEYWORD EXPLANATIONS
1. Regression
A statistical method used to estimate the relationship between a dependent variable and one or more independent variables based on observed data.
2. Single Linear Regression
A regression model with one independent variable used to estimate its linear effect on a continuous dependent variable. It takes the form:
Y = β0 + β1X + ε
Where Y is the dependent variable, X is the single independent variable, β0 is the intercept, β1 is the slope coefficient on X, and ε is the error term.
3. Multiple Linear Regression
A regression model with two or more independent variables used to estimate their linear effects on a continuous dependent variable. It takes the form:
Y = β0 + β1X1 + β2X2 + ... + βnXn + ε
Where Y is the dependent variable, X1 to Xn are the multiple independent variables, β0 is the intercept, β1 to βn are the slope coefficients, and ε is the error term.
4. Coefficient
The estimated parameter values from a regression model that quantify the effect of each independent variable on the dependent variable.
5. Statistical significance
A measure indicating whether a regression coefficient or test result is unlikely to have occurred by chance, determined by the p-value and significance level chosen.
6. Goodness-of-fit
Goodness-of-fit - Statistics like R-squared that indicate how well a regression model fits and explains the variation in the dependent variable based on the predictors.
7. Hypothesis testing
The use of sample data to determine whether to reject a hypothesis about a population parameter at a specified significance level based on statistical evidence.
8. Mean
A measure of central tendency calculated as the sum of all values divided by the number of values in a sample or population distribution.
9. Standard Regression Format
The conventional structure for presenting regression results including coefficient estimates, standard errors, and diagnostic statistics.
10. Descriptive statistics
A statement of no statistical significance or effect that is tested and either supported or rejected based on evidence from a sample.
11. Ordinary Least Squares (OLS)
A common method for estimating the coefficients in a linear regression model by minimizing the sum of squared residuals.
12. Adjusted R-squared
A modified version of R-squared that accounts for the number of predictors in the model. Used to assess goodness-of-fit.
13. F-test
A statistical test used to determine if the regression model as a whole has a statistically significant relationship with the dependent variable.
14. Significance level
The probability threshold used to determine statistical significance, most commonly 0.01, 0.05 or 0.10.
15. Dummy Variable
A binary categorical variable coded as 1 or 0 used to represent a qualitative characteristic
16. Interaction term
A variable created by multiplying two predictors to estimate their combined effect and test moderation effects.
17. T-test
A statistical test used to determine if a regression coefficient is significantly different from zero based on its t-statistic.
C/ DETAILED OUTLINE
I. Part 1: Overview and data description
1. Overview of topic (4-5 fist sentences)
- Search Google Scholar, EconLit, JSTOR for recent papers on "Innovation Efficiency Index", "Determinants of Innovation Efficiency", "Factors affecting Innovation Index", "Innovation performance measurement"
- Scan articles to identify key variables examined that influence Innovation Efficiency Index.
- Briefly summarize the main variables and expected relationships found in each paper.
- Compile a list of determinants frequently found to impact Innovation Efficiency Index based on reviewing 3-5 articles.
- Consider how these align with variables available in your dataset.
- Select 4-6 potential predictors to focus on in your analysis based on data availability and consistency in the literature.
Examples:
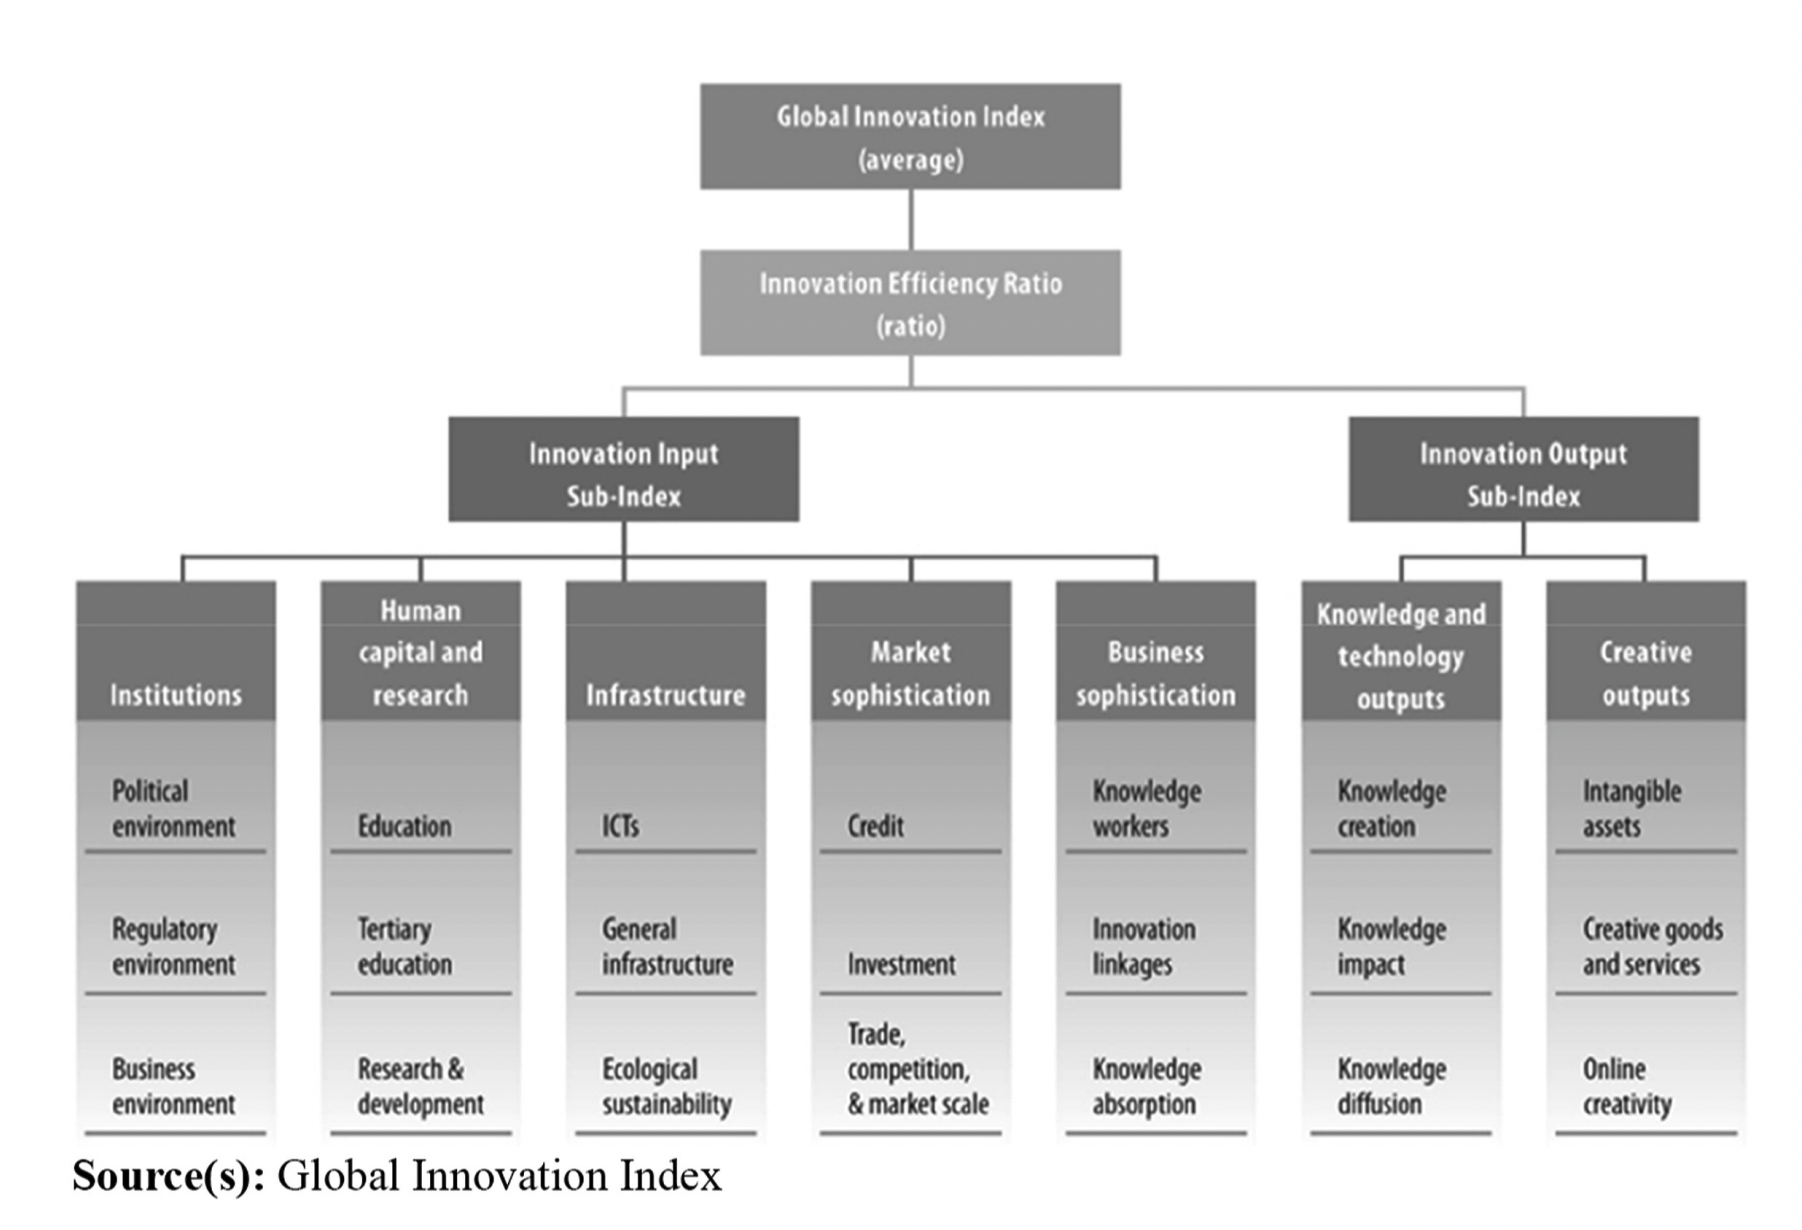
The Innovation Index, specifically the Global Innovation Index (GII), is designed to measure and rank the innovation performance of various economies around the world. It encompasses around 80 indicators to provide a comprehensive view of an economy’s innovation capabilities. These indicators cover various aspects including the political environment, education, infrastructure, and knowledge creation, thus offering a broad perspective on each economy's innovation strengths and weaknesses (wipo).
Economic Growth and Innovation: The Global Innovation Index 2023 underscores the role of innovation in navigating economic uncertainties and fostering growth. Economies that score higher on the GII tend to exhibit stronger economic resilience and capacity for recovery, especially in the face of global challenges such as economic downturns or geopolitical tensions (wipo 2023), since high innovation efficiency may optimize resource utilization (Xu 2023)
1. Regional Economic Trends: According to Deloitte's 2024 economic outlook, regions that actively engage in innovative practices, often reflected through their GII scores, are predicted to experience faster economic growth. For instance, Central Europe is expected to grow significantly faster than Western Europe, partly due to innovations and improved infrastructures that attract investments (Deloitte United States).
2. Global Economic Stability: The IMF's World Economic Outlook for 2024 indicates that global economic growth is expected to stabilize, with innovation playing a key role in supporting this stability. Economies that continue to innovate are likely to manage inflation better and maintain or even accelerate growth despite potential economic disruptions (IMF).
3. Corporate and Sectoral Impacts: McKinsey's global economic outlook for 2023 highlights how innovation impacts various sectors differently. Companies and sectors that are at the forefront of adopting innovative technologies and practices are likely to perform better and have more optimistic growth prospects even in uncertain economic times (McKinsey & Company).
The paper’s first assumption is that innovation and economic progress are highly correlated
in developed and developing countries (Lundvall, 2016; Cirera and Maloney, 2017; Edler and
Fagerberg, 2017). A straightforward way to test this assumption is by analyzing the relations
between the nations’ innovation index and their Growth Development Product (GDP).
Charge your account to get a detailed instruction for the assignment